My open source project · Plugin for Obsidian
Token Usage
Do you actually know your Claude limit? My plugin for Obsidian shows it to you, using nothing but your own data.
My plugin Token Usage reads the session files Claude Code already writes on your machine and shows usage, the five-hour windows and the weekly limit right in the Obsidian sidebar. It needs no API key and no cloud.
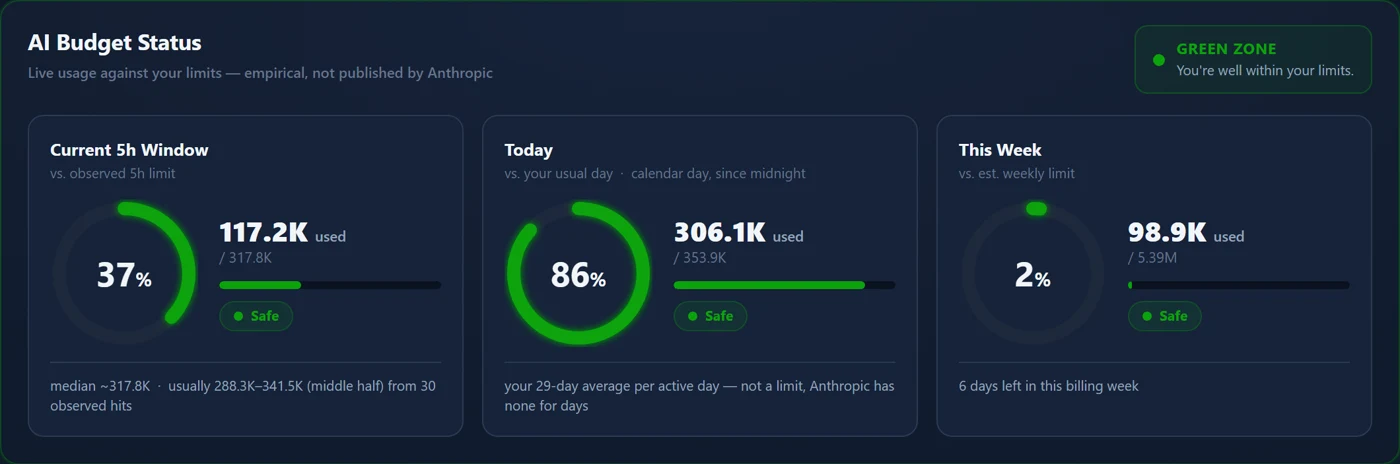
These are sample data, not real usage figures.
Why I built this
Anthropic keeps most details about tokens to itself, but the details are on your own disk.
Anthropic, like most other large AI providers, does not publish how many tokens sit behind a limit. For Claude Code, also in the Agent Mode of the Claude Desktop App, Token Usage turns that into a calculation and approximation from your own data: every time you hit a limit, the plugin remembers how much you had used by then. With every hit the calculation gets more accurate.
It is shown as a median together with a usual band, the middle half of your past hits. A single number would suggest more precision than the data has.
An estimate is only as good as the assumptions behind it, and in the current version 2.0 I corrected three of them. More in the changelog →
What the plugin does
One glance is enough, the dashboard offers more content and detail.
Three gauges, one heatmap
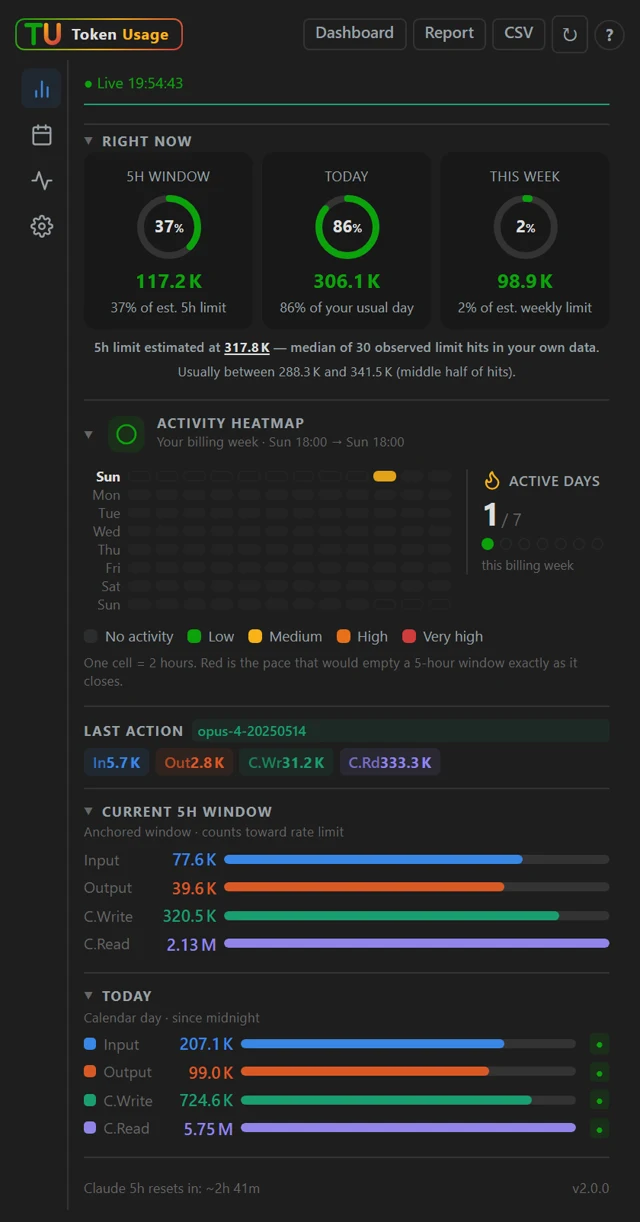
The current five-hour window and the current week are measured against the estimated limit, today against your own average. Below it, the heatmap of your billing week in two-hour cells.
- The five-hour window opens with your first message and runs exactly five hours.
- The weekly reset is detected from your own history. In the tool I use all the real data available that Anthropic stores locally for this.
- Today is compared with your own average, not with a theoretical daily limit that demonstrably does not exist.
Compare projects and vaults
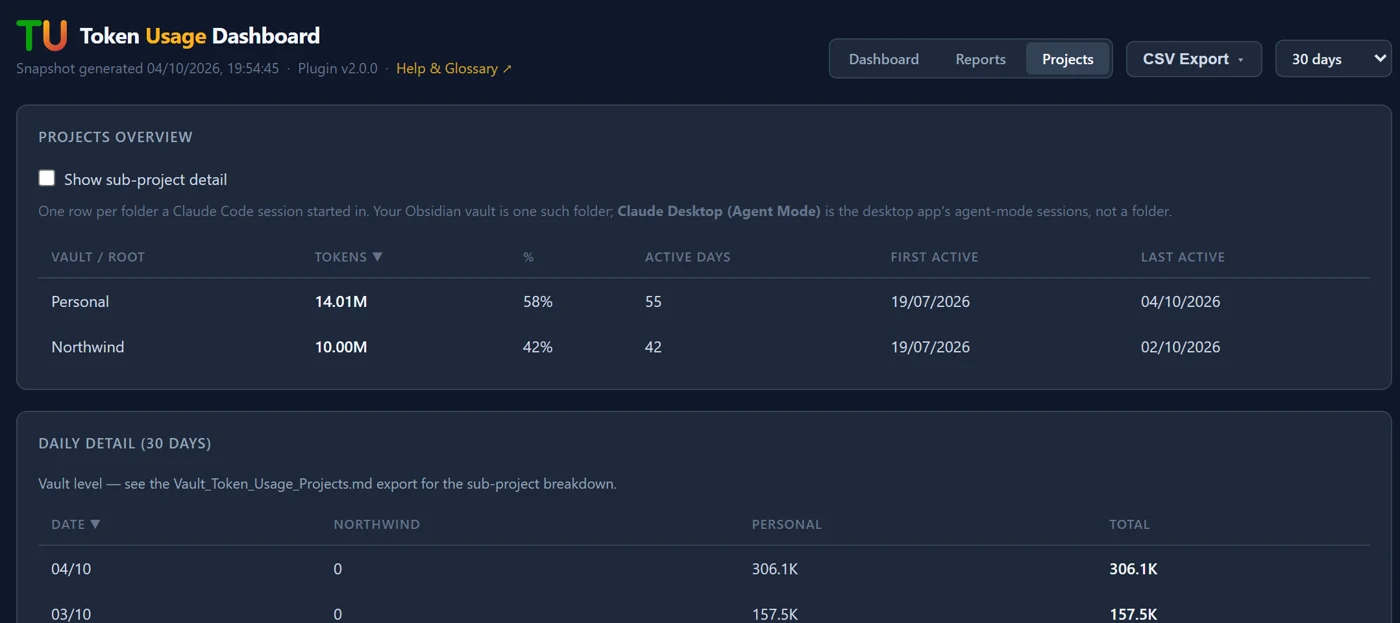
The HTML dashboard shows a forecast, the limits and model distribution. In the Projects tab you see which vault or project causes how much usage, down to the subfolders. This also makes project billing possible.
Handy when you work for several clients and want to attribute usage.
Your numbers are yours
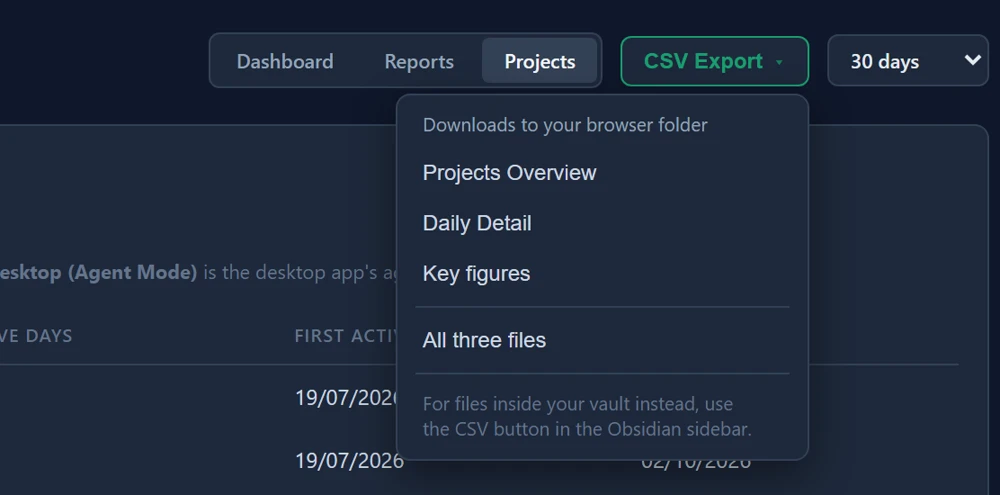
Projects, daily detail and key figures can be exported as CSV, three files in a format Excel opens right away. The daily values are also archived in your vault, beyond the retention period of Claude Code.
What the plugin deliberately leaves out
It reads along, and nothing else happens.
Nothing leaves your machine
No network requests, no telemetry, no server. Every number is calculated locally.
Read only
The plugin reads the session files of Claude Code. New files are created only in your own vault: the daily archive and, when you trigger it, report, dashboard and export. Prompts and responses are in none of them.
Open to inspect
The source code is on GitHub under the MIT license, and the release files carry a verifiable provenance attestation.
Status and outlook
What is new right now and what I plan next.
- No daily limit any more: today is compared with your own average.
- The five-hour window is anchored instead of rolling, and the estimate is measured in the same window.
- Heatmap around your billing week, CSV export and a Spanish interface.
- PlannedTell the cost of C.Write apart by cache duration, one hour versus five minutes.
- Under reviewA separate weekly limit for individual models, such as Fable, and whether it skews the weekly estimate.
- PlannedGive the documentation a uniform design and add Italian.
Whether something ships depends on what my data supports. None of this is a firm promise.
Installation
Set up in three steps.
- Find the plugin. In Obsidian go to Settings, Community plugins, Browse and search for
Token Usage. - Install and enable. The icon then appears in the left ribbon and the sidebar opens.
- Use Claude Code. The plugin reads the existing session files, so you see numbers after your first session.
Requirements: Obsidian 1.4.0 or later on the desktop and Claude Code on the same computer. Tested on Windows and macOS.
Background
Built out of my own need for a clearer overview.
I wanted a fuel gauge for my work with Claude Code and found none that sits where I work. So I built one myself with Claude Code. The story is on my blog, along with the mistakes I made in the process.